PPC Campaign Reporting: The Metrics Your Agency Should Be Showing You
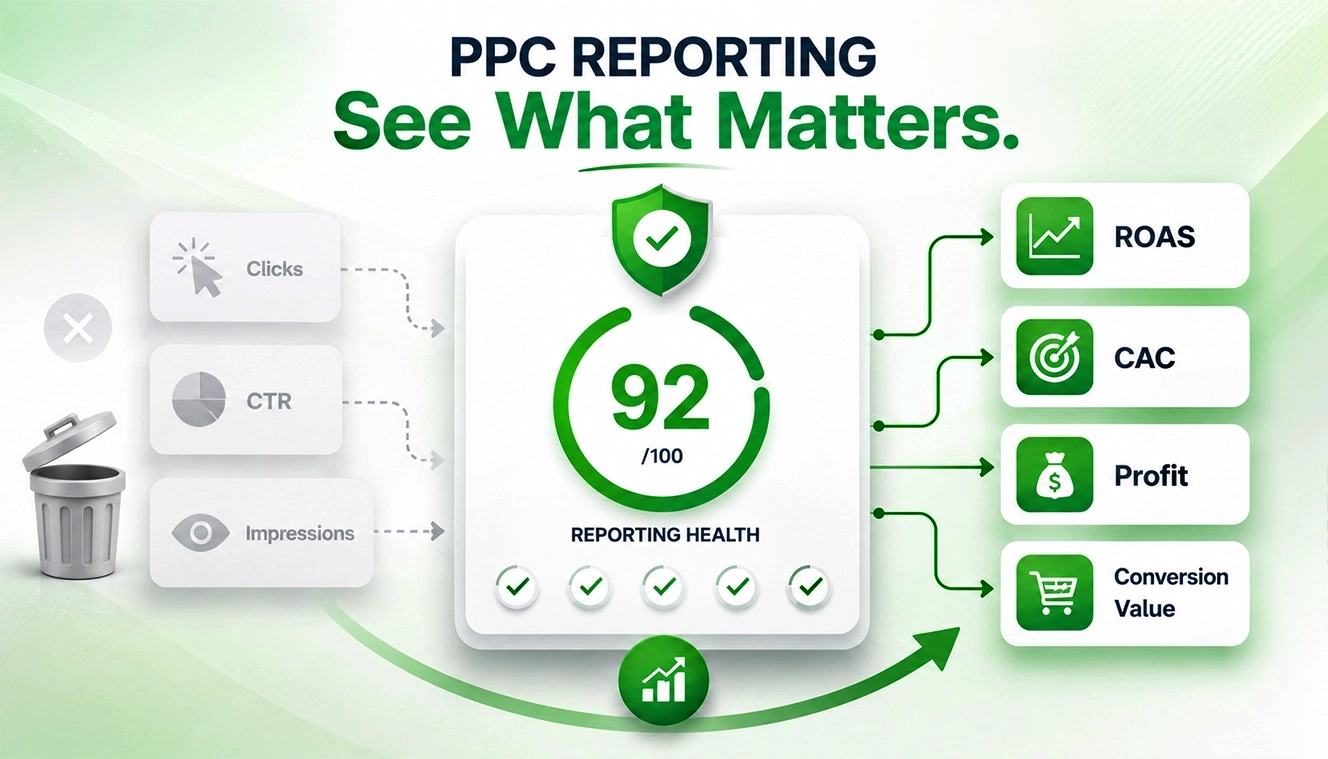
Let’s be honest here. Most PPC reports look impressive. Graphs are going up. Numbers everywhere. CTR, impressions, clicks. All neatly packaged in a dashboard that feels important. Yet many businesses still lack the PPC campaign reporting metrics needed to understand what is actually driving profitable growth.
But here’s the problem. A lot of it doesn’t actually help you make decisions. The most valuable PPC campaign reporting metrics often get buried beneath surface-level data that looks good in a report but offers little strategic insight.
Why Most PPC Reports Fall Short
Agencies often show what’s easy to report, not what’s useful. You’ll usually see:
- Impressions
- Click-through rates
- Cost per click
We are not saying these are useless; they’re just incomplete. Because they don’t tell you:
- Which campaigns are actually profitable
- Where are you wasting budget
- What’s scalable vs what’s just “working okay.”
And that gap? That’s where better reporting changes everything.
What Metrics Matter in PPC
Let’s break this down properly. No fluff.
1. Return on Ad Spend (ROAS)
This is the backbone of all PPC campaign performance metrics.
Simple Meaning:
For every ₹1 you spend on ads, how much money do you get back?
Formula:
Revenue / Ad Spend
Example:
You spend ₹1,000 on ads.
You make ₹4,000 in sales.
> ROAS = 4x
Translation:
For every ₹1 you spent, you got ₹4 back.
| Scenario | ROAS | What It Means |
|---|---|---|
| ₹1,00,000 revenue / ₹50,000 ad spend | 2x | Potentially profitable, depending on product margins and operating costs |
| ₹1,00,000 revenue / ₹1,00,000 ad spend | 1x | Revenue equals ad spend before accounting for other business expenses |
| ₹50,000 revenue / ₹1,00,000 ad spend | 0.5x | Advertising costs exceed generated revenue |
But here’s where many reports stop. They show ROAS, but don’t go deeper.
What you actually need:
- ROAS by campaign
- ROAS by product category
- ROAS by audience segment
Because average ROAS hides bad decisions.
2. Customer Acquisition Cost (CAC)
ROAS tells you revenue efficiency. CAC tells you the growth cost.
Simple Meaning:
How much does it cost you to get one new customer
Example:
You spend ₹10,000 on ads.
You get 50 new customers.
>CAC = ₹200 per customer
Translation:
You pay ₹200 to bring in one customer.
If you’re spending ₹2,000 to acquire a customer who only spends ₹1,500, you already know the issue. Good PPC management reporting always connects:
- Ad spend
- New customers acquired
- Cost per acquisition (true CAC, not just CPA)
Small difference. Huge impact.
3. Conversion Value by Channel & Funnel Stage
Not all clicks are equal. Not even close. Some campaigns:
- Bring traffic
- Some bring intent
- Some bring conversions
Simple Meaning:
Understanding where customers are in their buying journey
Your report should clearly separate:
- Top-of-funnel campaigns (awareness)
- Mid-funnel (consideration)
- Bottom-funnel (purchase intent)
Example:
Ad 1: “Best running shoes” → people just browsing
Ad 2: “Nike running shoes price” → serious buyers
Translation:
Not all traffic is ready to buy, and that’s okay.
If everything is mixed, optimization becomes guesswork.
4. Search Term & Query-Level Performance
This one is often ignored in PPC reporting best practices. But it’s gold.
Simple Meaning:
What people actually typed before clicking your ad
Example:
You’re selling shoes.
People searched:
“buy running shoes” → converts well.
“cheap shoes free delivery” → no sales
Translation:
Some searches bring buyers, others just waste money. You need to know:
- What people actually searched before clicking
- Which queries convert
- Which ones waste money
Without this, you’re basically running blind campaigns.
5. Profit (Not Just Revenue)
This is where things get real. Most PPC campaign reporting metrics include revenue. Very few show a profit.
Simple Meaning:
What you actually keep after all costs
Formula:
Profit = Revenue − Total Costs
Total costs include:
- Ad spend
- Product cost (COGS)
- Shipping
- Payment gateway fees
- Any discounts
Example:
Revenue = ₹10,000
Ad spend = ₹4,000
Product cost = ₹3,000
> Profit = ₹3,000
Translation:
Even though sales look big, the real earnings are ₹3,000.
And that’s a problem. Because:
- High revenue doesn’t always mean high margins
- Discounts, shipping, and returns affect real earnings
A strong PPC campaign reporting setup connects:
- Ad spend
- Revenue
- Cost of goods
- Net profit
Even a rough estimate is better than ignoring it.
What Metrics Are Often Missing (But Shouldn’t Be)
Here’s where most agencies quietly skip details. And honestly, this is where you should start asking questions.
Missing Metrics Checklist:
Incremental revenue (what ads actually added vs organic)
Simple Meaning:
How much extra money did your ads generate, beyond what you would have earned anyway (organically)
Easy Example:
Let’s say:
Without ads, you normally make = ₹50,000/month
With ads, you made = ₹80,000/month
> Incremental Revenue = ₹30,000
Translation:
Out of ₹80,000 total sales,
- ₹50,000 would have happened anyway
- ₹30,000 is what ads actually added
Why This Metric Matters (A Lot)
Without this, you might think your ads are performing great. But actually, they’re just capturing existing demand.
New vs returning customer split
Simple Meaning:
Are your ads bringing new people or just existing customers again?
Example:
Out of 100 sales:
70 are old customers
30 are new
Translation:
You’re not really growing much; just re-selling.
Lifetime value (LTV) trends
Simple Meaning:
How much a customer spends with you over time
Example:
A customer buys:
First order = ₹1,000
Comes back 3 more times
> Total = ₹4,000
Translation:
That one customer is worth ₹4,000, not ₹1,000.
Attribution breakdown (last-click vs data-driven)
Simple Meaning:
How do you give credit to ads for a conversion (sale/lead)?
Different models decide which ad gets the credit.
Example:
A customer journey:
- Sees your Facebook ad
- Searches on Google → clicks your ad
- Comes back directly and buys
> Last-click attribution: Gives 100% credit to the last step (Direct visit)
> Data-driven attribution: Splits credit across all steps (Facebook + Google + Direct)
Translation:
Last-click says: “Only the final touch matters.”
Data-driven says: “Every touchpoint helped the sale.”
Device-level performance
Simple Meaning:
How your ads perform on different devices (mobile, desktop, tablet).
Example:
Your campaign results:
Mobile: 100 clicks → 2 sales
Desktop: 50 clicks → 5 sales
Translation:
Mobile brings traffic
Desktop brings actual buyers.
So you might lower the mobile budget and increase desktop bids
Core Web Vitals & PPC: Why It’s Now Part of Reporting
A lot of people still underestimate this part. But it quietly affects everything.
You can have the best ad copy, perfect targeting, solid bids, and still lose conversions.
Why? Because the landing page just doesn’t feel right.
Maybe it loads a bit slowly.
Maybe buttons lag.
Maybe something shifts while the user is about to click.
And just like that, they’re gone. That’s where Core Web Vitals come into play, not just for SEO anymore, but for PPC performance too.
The Metrics That Actually Matter:
| Metric | What It Really Affects |
|---|---|
| Largest Contentful Paint (LCP) | Measures how quickly the primary content becomes visible to users |
| Interaction to Next Paint (INP) | Reflects how responsive the page feels after user interactions |
| Cumulative Layout Shift (CLS) | Indicates visual stability and how much page elements unexpectedly move |
Why This Matters for PPC Campaign Performance
- Slow interaction → Higher bounce rates
- Frustrated users → Lower conversion rates
- Poor experience → Wasted ad spend
So yeah, this isn’t just a “technical SEO thing” anymore. It directly impacts your PPC campaign reporting metrics, especially:
- Conversion rate
- Cost per acquisition (CAC)
- Overall ROAS
Better experience = better outcomes.
PPC Reporting for eCommerce: What’s Changed in 2026
Things aren’t the same anymore. User behavior has shifted. Platforms have evolved. And reporting? It needs to keep up.
Key Trends:
- AI-driven campaign optimization
Platforms automate bidding, but reporting must validate results. - Attribution is less reliable
Privacy updates mean you can’t rely on last-click anymore. - First-party data is everything
Your CRM and analytics need to be part of reporting. - Blended ROAS is becoming standard
Looking at total revenue vs total ad spend, across all channels.
A Simple Framework for Better PPC Reporting
If you want clarity (and not just pretty dashboards), your reports should answer:
- Where is money being spent?
- What is generating real profit?
- What should be scaled?
- What should be cut immediately?
That’s it. Everything else is secondary.
What Good PPC Management Reporting Looks Like
Not overwhelming. Not overly simplified. Just clear.
It should include:
- Weekly performance summary (short, actionable)
- Deep-dive monthly analysis
- Campaign-level profitability insights
- Clear next steps (this is important)
And yes, fewer charts and more insights.
Quick Comparison: Basic vs Advanced PPC Reporting
| Basic Reporting | Advanced Reporting |
|---|---|
| Clicks, impressions | Profit analysis and ROAS segmentation |
| CPC, CTR | Customer acquisition cost (CAC) tracking |
| Total conversions | Funnel-level performance measurement |
| Generic dashboards | Actionable insights and optimization recommendations |
If your report looks like the left column, you’re missing opportunities.
A Small Reality Check
Even the best PPC campaigns don’t work all the time. Some weeks dip. Some campaigns fail.
That’s normal. What’s not normal is not knowing why. And that’s exactly what proper PPC reporting metrics solve. If you feel overwhelmed by all these metrics, it’s always good to opt for PPC management services, which can simplify everything.
Final Thoughts
PPC isn’t just about running ads anymore. It’s about understanding outcomes. Clear reporting helps you:
- Spend smarter
- Scale faster
- Avoid silent losses
And honestly, once you start looking at the right numbers, it’s hard to go back.
Ready to Improve Your PPC Reporting?
If your current reports feel surface-level, it might be time to rethink your approach. Start small:
- Ask better questions
- Demand deeper insights
- Focus on profitability, not just performance
Because at the end of the day, clicks don’t grow your business. Decisions do.
Turn complex PPC data into clear, actionable insights. Build smarter campaigns, improve ROAS, and grow with confidence.
Frequently Asked Questions
1. What are the most important PPC campaign reporting metrics?
The most important PPC campaign reporting metrics typically include ROAS, customer acquisition cost (CAC), conversion value, and overall profitability, as these provide a clearer picture of campaign performance.
2. How often should PPC reports be reviewed?
Weekly reviews help monitor performance and identify immediate issues, while monthly reporting is ideal for deeper analysis, trend evaluation, and strategic decision-making.
3. What metrics matter most in PPC for ecommerce businesses?
Ecommerce businesses should focus on ROAS, customer acquisition cost, customer lifetime value, conversion rates, and product-level profitability to measure sustainable growth.
4. What are typical PPC ROAS benchmarks?
ROAS benchmarks vary by industry and business model, but many ecommerce brands consider a return of 3x to 5x ad spend a strong performance target.