Picture a Shopify store that doubled its revenue in a year and ended it with the same $15,000 in the bank. Orders went up. Ad spend went up. Profit didn’t move.
It happens more than most owners admit. A campaign shows a 3.0 ROAS, the dashboard looks great, and then shipping, returns, and payment fees get counted. That “winning” ad is losing money on every order.
This guide explains how ecommerce profit margins are calculated, what a good number looks like in 2026 by sales channel, and the specific levers that improve margin without choking growth. Growth isn’t about how much you sell. It’s about how much you keep.
QUICK ANSWER
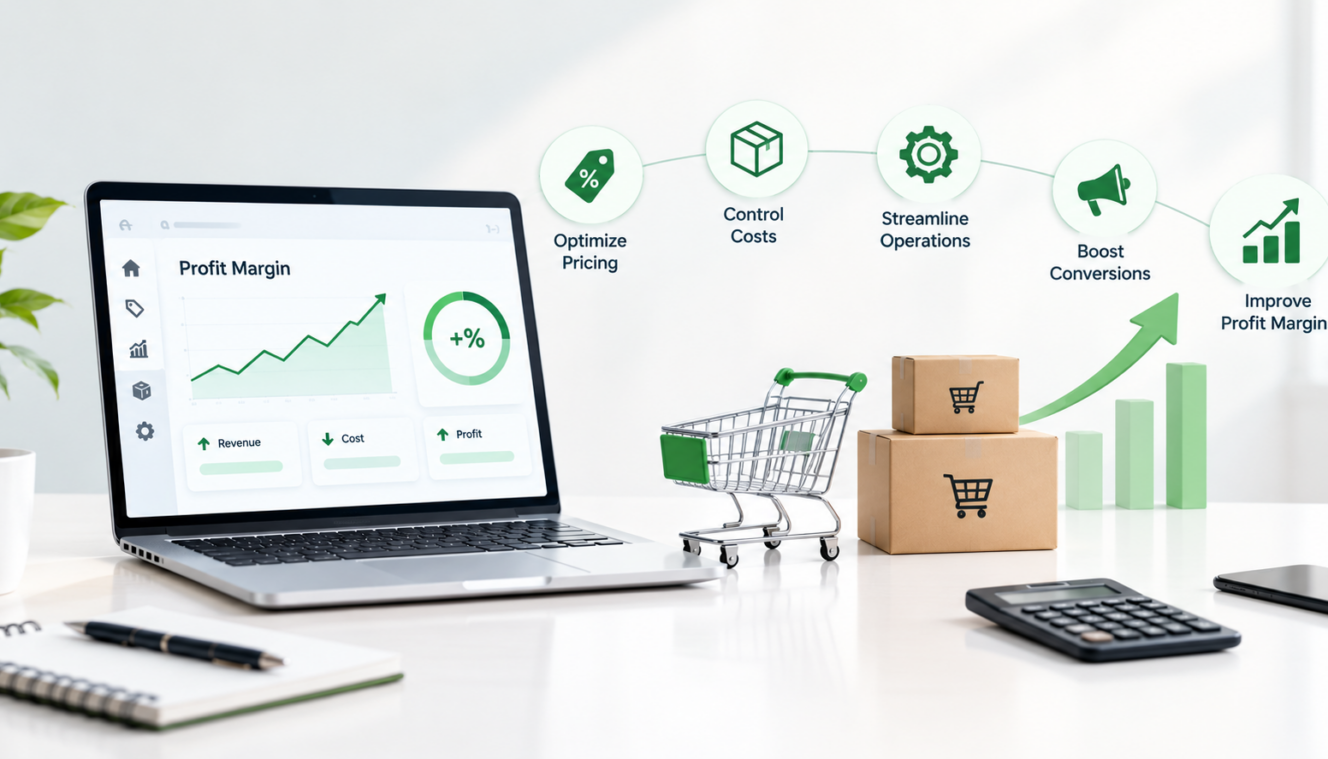
Ecommerce profit margins show how much profit your online store keeps after covering product costs, shipping, advertising, fees, returns, and overhead. In 2026, a net profit margin of 10%–20% is generally considered healthy, although benchmarks vary by industry and sales channel. To improve margins, calculate contribution margin per product, optimize shipping costs, reduce returns, control ad spend, and increase average order value. Automating repetitive tasks and streamlining store operations can further reduce costs while supporting sustainable growth.
What Are Ecommerce Profit Margins?
Ecommerce profit margins show the percentage of each sales dollar a store keeps as profit after costs. Which costs you subtract decides whether you’re looking at gross, contribution, or net margin.
Most owners track revenue and gross margin. Fewer track the other two. That’s where the surprises live.
Gross vs. Contribution vs. Net Profit Margin
Table 1: The three margin types
| Margin Type |
What It Measures |
Formula |
Typical Ecommerce Range |
| Gross profit margin |
Revenue left after product costs (COGS) only |
(Revenue − COGS) ÷ Revenue × 100 |
Roughly 60% to 70% is common; under 50% makes growth fragile |
| Contribution margin |
Revenue left after all variable costs per order: COGS, shipping, payment fees, ads, returns |
(Revenue − all variable costs) ÷ Revenue × 100 |
Varies widely by category; the number that should drive ad spend decisions |
| Net profit margin |
What the business keeps after every expense, including overhead |
(Revenue − all expenses) ÷ Revenue × 100 |
Roughly 10% to 20% for healthy stores; above 20% is top tier; under 5% needs attention |
Here’s how it works out when we use round figures. The store generated $100,000 revenue in a month. Cost of goods sold (COGS) is $40,000, so gross profit margin is 60%.
Next, include the costs that increase with each order: $8,000 for shipping and packaging, $3,000 in payment fees, $20,000 for advertising, and $4,000 for returns and refunds. The contribution margin comes out to 25%.
Subtract $10,000 of overhead, such as software and payroll, and net profit margin settles at 15%. Same store, three numbers, three very different stories.
A 60% gross margin sounds comfortable. It isn’t, if 45 of those points are gone before the month ends.
You don’t need special software to run this. A spreadsheet with revenue, each cost line, and the three formulas above works as a basic ecommerce profit margin calculator. Profit analytics apps automate the same math if you’d rather not maintain it by hand.
What Is a Good Ecommerce Profit Margin in 2026?
Healthy online stores generally sit in the 10-20% net profit margin range, with the best of them making more than 20%. And a gross profit margin of around 60-70% leaves a shop enough space for ads, shipping, and operational costs.
But the published benchmarks aren’t unanimous, and you should know that. Our research at TrueProfit of 5,000+ stores (January 2025 February 2026) finds that a “healthy” net margin is 15% to 25%. That’s vendor data, and it’s probably skewed toward the profit-conscious store. Finance providers working directly with DTC brands report far thinner medians often from 3% to 10%.
So which is right? Both, for different groups of stores. Ecommerce profit margins vary by category, price point, and business model. Treat any single “good” number as a starting point, not a verdict.
Profit Margins by Sales Channel
Table 2: Typical net margin by channel
| Sales Channel |
Typical Net Margin |
Main Margin Pressure |
Best Use in a Margin Strategy |
| Direct to consumer (Shopify, WooCommerce) |
Roughly 10% to 20% for healthy brands; reported DTC medians run lower, near 3% to 10% |
Customer acquisition cost, shipping, app and platform fees |
Primary profit engine; move repeat buyers here |
| Walmart Marketplace / eBay |
Roughly 8% to 15% (planning estimate; few public benchmarks) |
Referral fees, price competition |
Secondary channel for incremental reach |
| Amazon |
Roughly 5% to 20% (seller surveys skew higher, full cost audits skew lower) |
Referral and FBA fees, advertising, returns |
Volume and visibility; acquire customers, then build repeat sales elsewhere |
Don’t read Table 2 as a strict ranking. The spread inside each row is wide, and that’s the point.
Amazon is the clearest case. Jungle Scout’s survey found that 57% of small and midsize sellers report margins above 10%, but those numbers are self reported. The fees tell a tougher story. Most categories charge a 15% referral fee, and once fulfillment, storage, returns, and ads are added, Amazon can take 30% to 45% of the selling price. Margin only holds if your COGS and ad spend stay tight
Marketplaces rent you traffic. Your own store makes you build it, which costs money up front but gives you pricing control and customer data. That trade is why many brands use marketplaces to find buyers and their own store to keep them.
When a Margin Is Too Low to Sustain
Net margins that sit below roughly 3% to 5% month after month leave no buffer. One carrier surcharge, one bad ad month, one supplier price jump, and you’re in the red.
The more useful question is why the margin is low. Some problems are structural. A category with a 35% gross margin, heavy items with low order values, or a market where everyone competes on price won’t be fixed by tactics alone.
Others are operational. Gross margin looks healthy, but net is thin. That’s a leak, and leaks can be found.
A rough test: if gross margin is under 50% and you can’t raise prices or cut COGS, be honest with yourself about the model. If gross margin is strong and net is weak, keep reading.
Where Ecommerce Profit Margins Leak
Margins rarely collapse in a single quarter. They erode. A surcharge here, a fee there, a discount that quietly became a habit.
Advertising and Customer Acquisition Costs
Ads are usually the highest variable cost after COGS. Customer acquisition cost (CAC) has crept up for many brands over the past few years, and scaling spend often makes each new customer more expensive, not less.
The trap is judging campaigns by ROAS alone. ROAS counts revenue. It ignores what it cost to make, ship, and sometimes take back the product.
Shipping, Fulfillment, and Packaging
UPS and FedEx both raised rates by an average of 5.9% for 2026, but surcharges rose faster. Analysts estimate effective increases of 8% to 12% for many merchants once residential, delivery area, and handling fees are added.
Shipping often runs 10% to 15% of order value. Watch the surcharges, because they hit what many stores do most: sending light but bulky boxes to homes.
Returns and Refunds
The National Retail Federation (NRF) and Happy Returns estimated that 19.3% of online sales would be returned in 2025, and that about 9% of all returns were fraudulent. Your category may run higher or lower, but online returns are a real cost, not a rounding error.
Think about a $60 order that comes back. You paid to ship it out, you may pay for the return label, someone spent time processing it, and the item might not sell again at full price. Amazon sellers take an extra hit, since a refunded referral fee is returned minus an administration fee of $5 or 20% of the referral fee, whichever is less.
Returns also create support tickets. Handling them well, through a clear process and fast answers, is part of ecommerce customer support that protects margin instead of just answering email.
Platform, App, and Payment Processing Fees
Individually small, collectively stubborn. A few examples:
- For Basic, Shopify Payments costs 2. 9% + 30 cents per online card sale. For Grow, 2.7% + 30 cents, and Advanced costs 2.5% + 30 cents.
- Use a third party gateway like Stripe or PayPal instead, and Shopify charges an additional 2% on Basic. That works out to around 4.9% plus 30 cents.
- In most categories, Amazon will take a 15% referral fee. Amazon’s FBA fulfillment fees increased an average of $0. 08/unit in 2026, and a 3. 5% FBA surcharge on fulfillment fees also began on April 17.
Apps are quieter. Ten subscriptions at $20 to $50 a month feel invisible until you add them up.
Heavy Discounting and Promotions
Take a product that sells for $100 with $40 of COGS. That’s $60 of gross profit. Run 20% off and you’re selling at $80, so gross profit drops to $40. That’s a one third cut in profit per unit.
To make up for it, you’d need to sell 50% more units. Rarely happens. And discounts teach customers to wait for the next one.
Manual, Labor Heavy Operations
This leak hides in payroll and time rather than invoices. Copying orders between systems, chasing tracking numbers, answering “where’s my order” emails, and reconciling inventory across Shopify and Amazon all add minutes to every order.
Small numbers compound. Cut $1 of handling cost per order across 1,000 monthly orders and you keep $12,000 a year. At 5,000 orders, it’s $60,000. This is where better order management support earns its place in a margin plan.
Strategies to Improve Ecommerce Profit Margins
Fourteen strategies, grouped into four levers. Find the leak that matches your numbers and start there.
Lever 1: Track the Right Numbers First
You can’t fix what the dashboard hides. Do this before touching prices or ads.
Strategy 1: Calculate contribution margin per SKU and per channel
Average storewide gross margin masks the truth. Take out the revenue from every product and then subtract COGS, shipping, payment fees, returns, and the ad spend that made it.
Usually, just a small number of products generate the profit and a few silently eat it away. Heavyweight items, high return items, and items that only sell when discounted are generally on the list.
Strategy 2: Know your breakeven ROAS and LTV:CAC before scaling
Breakeven ROAS is 1 divided by your contribution margin before ad spend. If a product keeps 30% after COGS, shipping, fees, and returns, breakeven is 1 ÷ 0.30, or about 3.3.
So a campaign showing a 3.0 ROAS looks fine and loses money. Every $1 of spend brings $3 of revenue, but only $0.90 of contribution.
Also check LTV:CAC, the ratio of lifetime customer value to acquisition cost. A ratio around 3 to 1 is a common rule of thumb, not a law. Subscription brands may need more, and categories with strong repeat buying can accept less.
Lever 2: Lower Your Costs
Strategy 3: Renegotiate supplier terms and qualify alternates
Ask for volume tiers. Offer faster payment in exchange for a discount. Quote a second supplier, even if you don’t plan to switch. Tariff changes have made COGS less predictable for many importers, so having alternatives isn’t just about price.
One caution: squeezing a good supplier for 5% can cost you reliability. Trade volume or payment terms, not just pressure.
Strategy 4: Optimize shipping and fulfillment
Start with the boring work.
- Carrier negotiation. Volume discounts exist, and published rates aren’t your rates.
- Rate shopping. Compare carriers per order instead of defaulting to one.
- Right sized packaging. Dimensional weight charges you for air.
- Consolidated shipments. Fewer boxes per order cuts per package surcharges.
- 3PL contracts. A third party logistics provider’s pick, pack, and storage fees are negotiable at renewal, and worth auditing yearly.
Watch the surcharges. They’re often where the real increase hides.
Strategy 5: Reduce return rates at the source
Read return reasons, not just return rates. “Too small” means your size guide isn’t working. “Not as described” means photos or copy oversell.
Fix product pages first: accurate dimensions, real photos from several angles, clear materials, and honest fit notes. Customer reviews are free research here.
Strategy 6: Audit apps, subscriptions, and payment fees
Open your Shopify app list. Honestly, most stores have apps nobody remembers installing. Cancel anything that doesn’t tie to a number you can name.
If you’re routing payments through a third party gateway on Basic only out of habit, test Shopify Payments. That 2% surcharge is the most avoidable fee on the list.
Strategy 7: Automate and streamline operations
Cost per order is an operations metric, and it’s one most margin articles skip. Order processing, inventory sync, support triage, and data entry are repetitive, predictable, and expensive when done by hand at full time salaries.
Two routes usually help. AI tools and workflow automation handle routing and updates. A trained dedicated virtual assistant can take on exceptions, order checks, and customer messages without adding full time headcount.
Neither is free. Setup takes effort, and automating a messy process just makes the mess faster. Start with your highest volume repetitive task.
Lever 3: Raise Revenue Per Order
Strategy 8: Refine your pricing strategy
Price on value, not just cost plus a markup or what competitors charge. Test a few price points on select SKUs, track conversion and contribution margin, and don’t let seasonal swings skew the results.
Protect how customers see your brand. If you compete only on price, you’re always one cheaper rival away from a margin problem.
Strategy 9: Increase average order value with bundles and upsells
Average order value (AOV) is important because lots of expenses are per basket, not per dollar. Packing, service, and some of shipping don’t double if the basket doubles.
Complements, “complete the set” cross sells at checkout, and post purchase upsells all do. But do the math. If an add on is heavy, it may increase shipping and consume the profit.
Strategy 10: Set a free shipping threshold above your current AOV
If your AOV is $62, a free shipping threshold at $75 nudges customers to add an item. Many stores start 10% to 30% above current AOV and test from there. It’s a rule of thumb, so measure your own conversion.
Strategy 11: Reduce reliance on blanket discounts
Site wide percentage sales are easy and expensive. Swap them for targeted offers: loyalty perks, bundle pricing, free gifts with purchase, or discounts only on slow moving inventory.
If customers already wait for your sales, you won’t fix it overnight. Taper gradually.
Lever 4: Improve Marketing and Channel Efficiency
Strategy 12: Move ad decisions from ROAS to profit based metrics
Judge campaigns on contribution after ad spend, and watch your blended marketing efficiency ratio (total revenue divided by total ad spend) for the full picture. Platform ROAS is useful for creative testing. It’s a poor judge of profit.
Strategy 13: Invest in retention and repeat purchases
Selling again to a happy customer typically costs far less than acquiring a new one. Email and SMS flows, replenishment reminders, loyalty programs, and subscriptions all push repeat rate.
Retention won’t fix a bad product, so make sure returns and reviews look fine first.
Strategy 14: Balance your channel mix
Use higher volume marketplaces like Amazon and Walmart to reach new buyers, and nudge repeat buyers toward your higher margin direct store. One warning: marketplaces restrict how you can contact their customers, Amazon especially. Read each platform’s current policies before you design any “move them to our site” flow.
Which Margin Levers to Pull First
Not everything needs doing this quarter. This order works for most stores.
| Speed |
Levers |
Why |
| Always first |
Contribution margin per SKU (Strategy 1) |
Shows where the money is actually made or lost |
| Fast (days to weeks) |
App and fee audit, shipping renegotiation, discount discipline, free shipping threshold |
Low effort, immediate cost impact |
| Medium (1 to 3 months) |
AOV bundling, return reduction, operations automation |
Need testing and process changes |
| Longer term |
Pricing repositioning, channel mix, retention infrastructure |
Bigger payoff, slower to build |
If your biggest leak is manual work, ecommerce operations support usually belongs in the medium group. Staffing and systems take time to set up, then keep paying back as volume grows.
Ready to boost your Ecommerce store Profit Margins?
Get a free consultation audit from EcomVA and see exactly how we optimize your store to bring more sales.
Contact Us
A Worked Example: How Small Changes Compound
This is an illustrative example with round numbers, not a client result.
Take the store from earlier: $100,000 in monthly revenue, 1,000 orders at a $100 average order value, and a 15% net margin. Now make three modest changes:
- Cut shipping and handling cost per order by $2, split between better rates and less manual work.
- Raise AOV by $5 through bundles and a free shipping threshold.
- Trim return costs from $4,000 to $3,000 by fixing product page problems.
| Line Item |
Before |
After |
| Revenue (1,000 orders) |
$100,000 |
$105,000 |
| COGS |
$40,000 |
$42,000 |
| Shipping and packaging |
$8,000 |
$6,500 |
| Payment fees |
$3,000 |
$3,150 |
| Advertising |
$20,000 |
$20,000 |
| Returns and refunds |
$4,000 |
$3,000 |
| Overhead |
$10,000 |
$9,500 |
| Net profit |
$15,000 |
$20,850 |
| Net profit margin |
15.0% |
About 19.9% |
Profit rose by $5,850 a month, close to 5 points of margin, with no price cut, no new customers, and no extra ad spend. The three changes contributed $2,000, $2,850, and $1,000 respectively.
Real stores will differ. The point is the shape: several small fixes beat one big hope.
Conclusion: Keep More of What You Sell
Improving ecommerce profit margins is rarely about one dramatic move. It’s a system of small, compounding changes across costs, pricing, and marketing efficiency.
So keep the order simple. Calculate contribution margin first. Fix the fastest leaks next, like fees, shipping, and discounts. Then work through the slower levers like pricing, channel mix, and retention at a pace your business can handle.
Not sure where your margin is leaking?
If your revenue is growing faster than your profit, manual work and process gaps are a likely culprit, and they’re often the easiest to measure. EcomVA offers an operations and cost per order review that looks at where order handling, support, and data entry add cost, and where a trained ecommerce virtual assistant could help you stay lean as volume grows.
Explore our ecommerce virtual assistant services, or request a consultation to talk through your numbers.